Cooling Tower Water Analysis: Complete Guide
Analyzing cooling tower water is an essential step to maintain system performance and prevent physico-chemical or biological drift. Cooling towers play a central role in industrial heat rejection, but their operation depends on the stability of the circulating water.
This article presents the key parameters, analytical methods and tools to optimize your in-house monitoring.
Why analyze cooling tower water regularly?
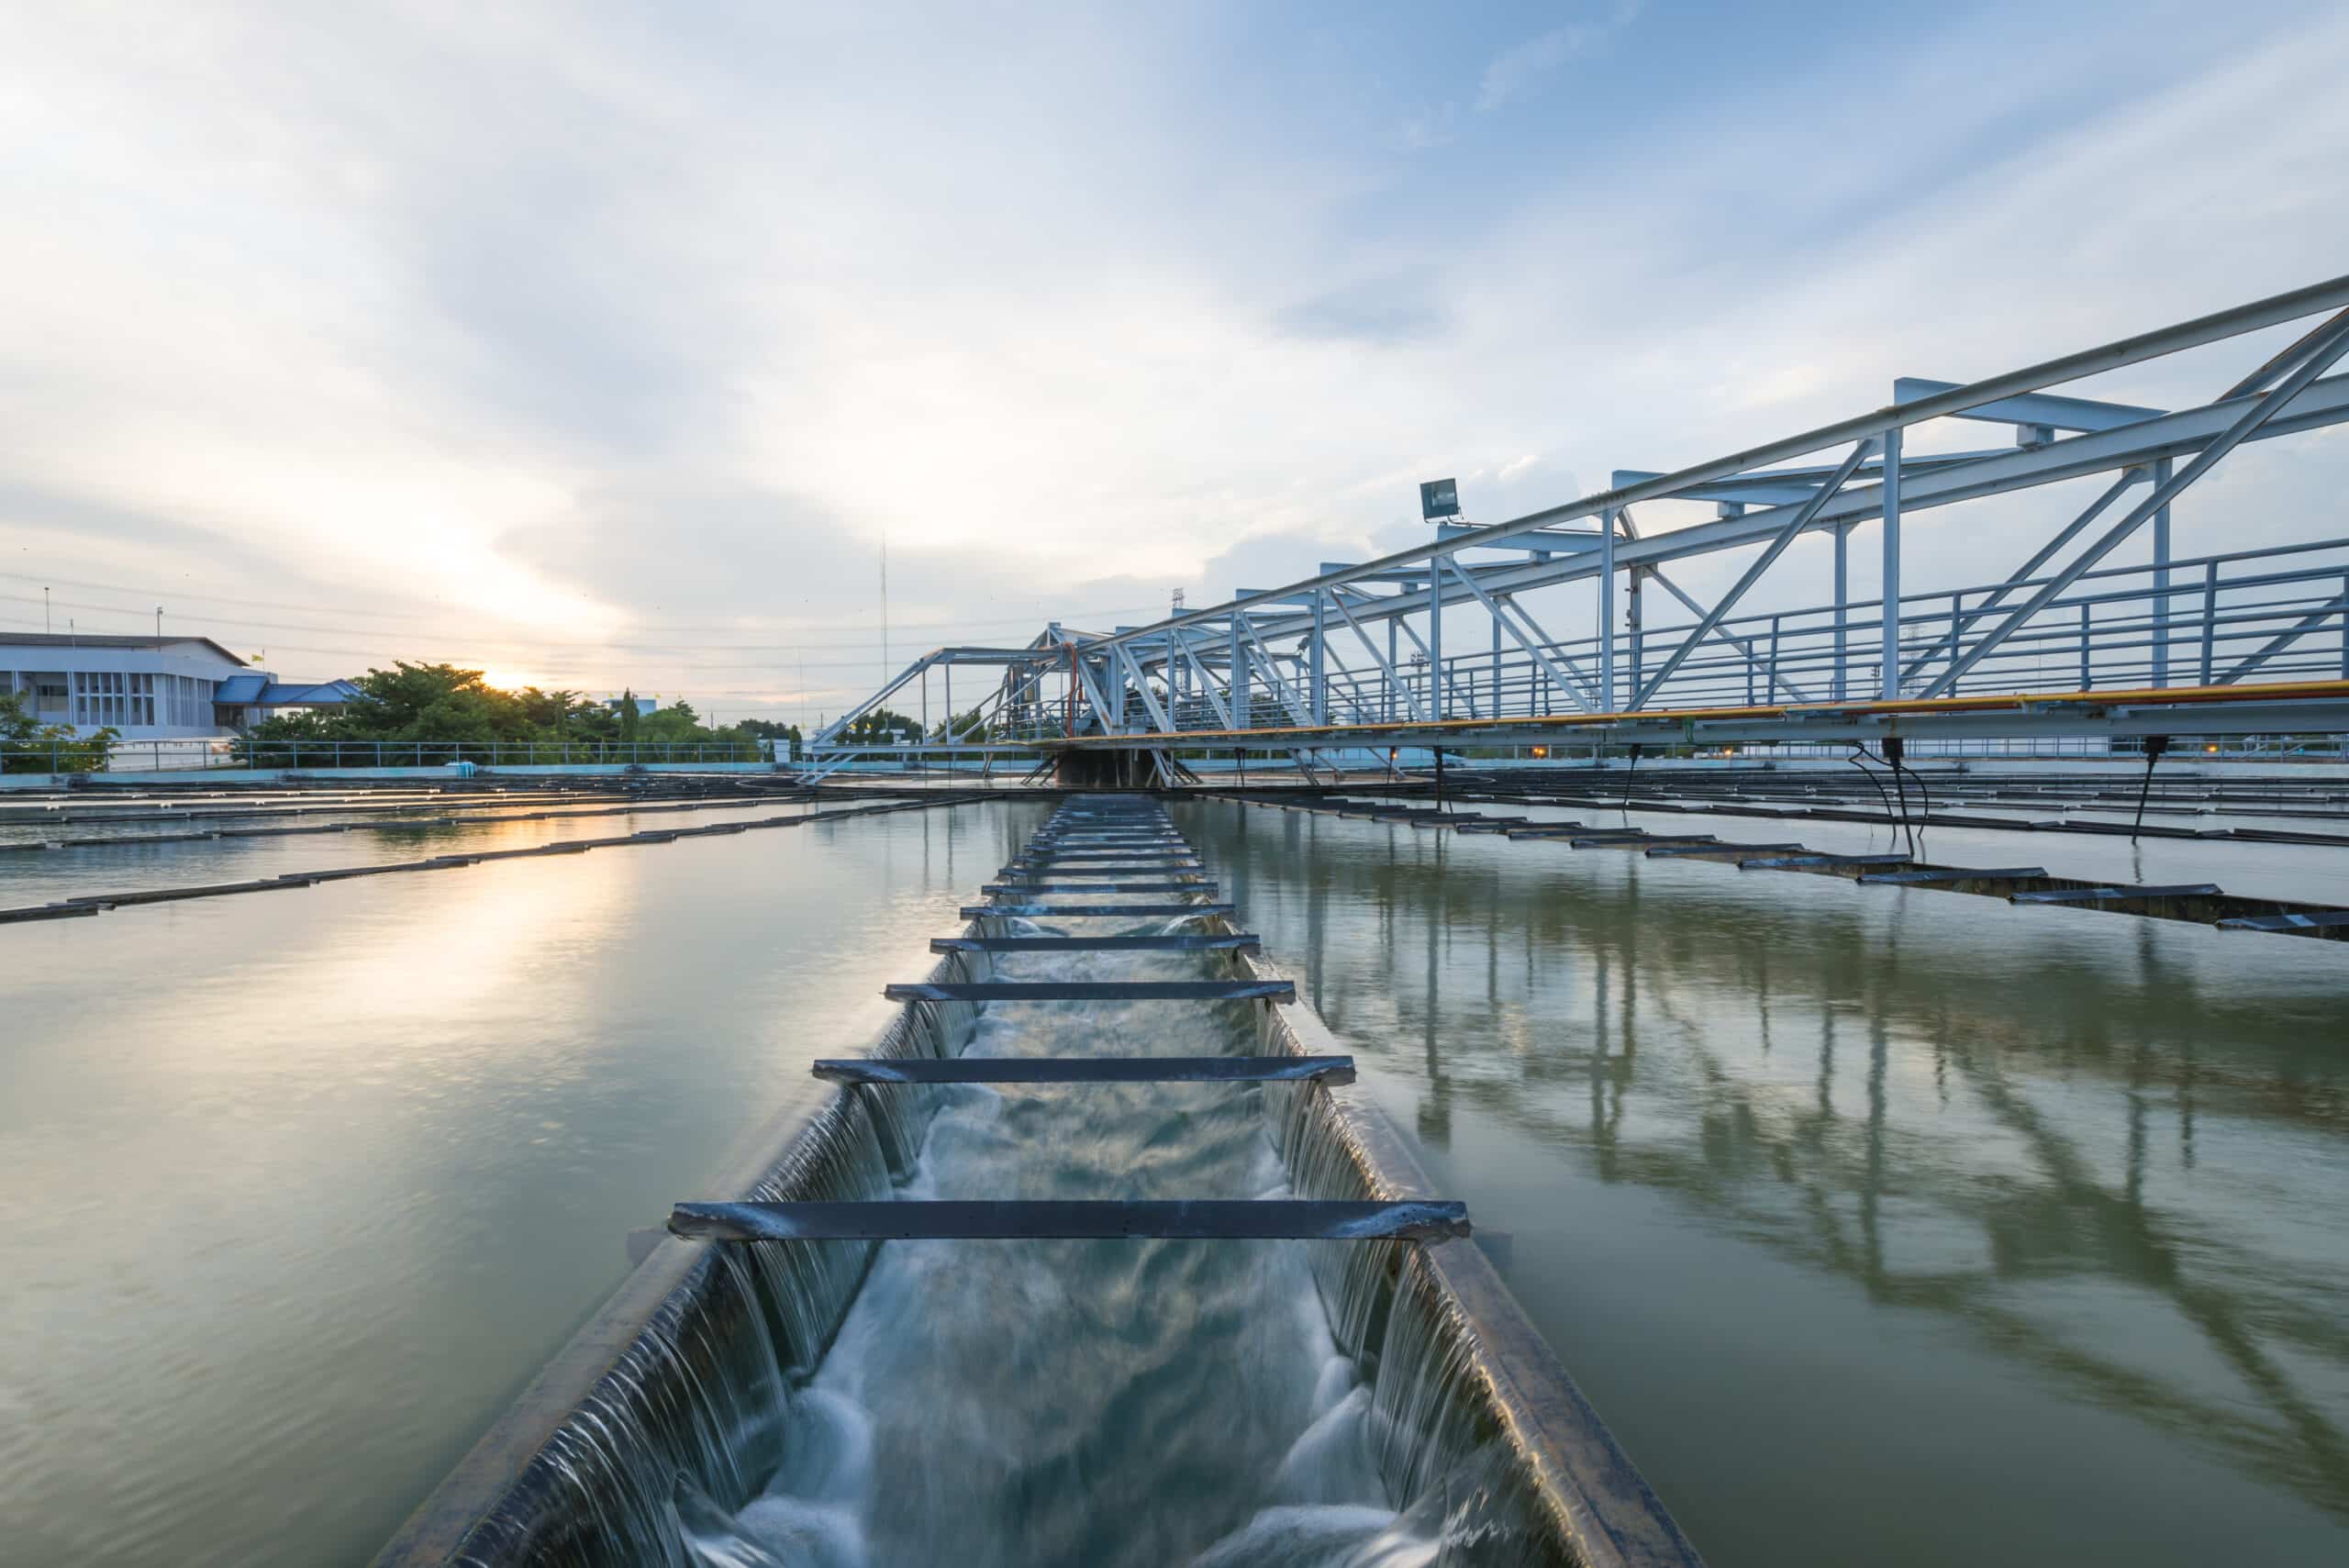
Cooling towers cool industrial equipment by dissipating heat into ambient air. Their operation relies on a delicate balance between water quality, thermal efficiency and biological stability. Regular cooling tower water analysis is necessary to meet regulatory requirements, limit health risks, especially those related to Legionella, and preserve the overall efficiency of the installation. Analytical monitoring helps confirm that this balance is maintained and enables early detection of any treatment drift.
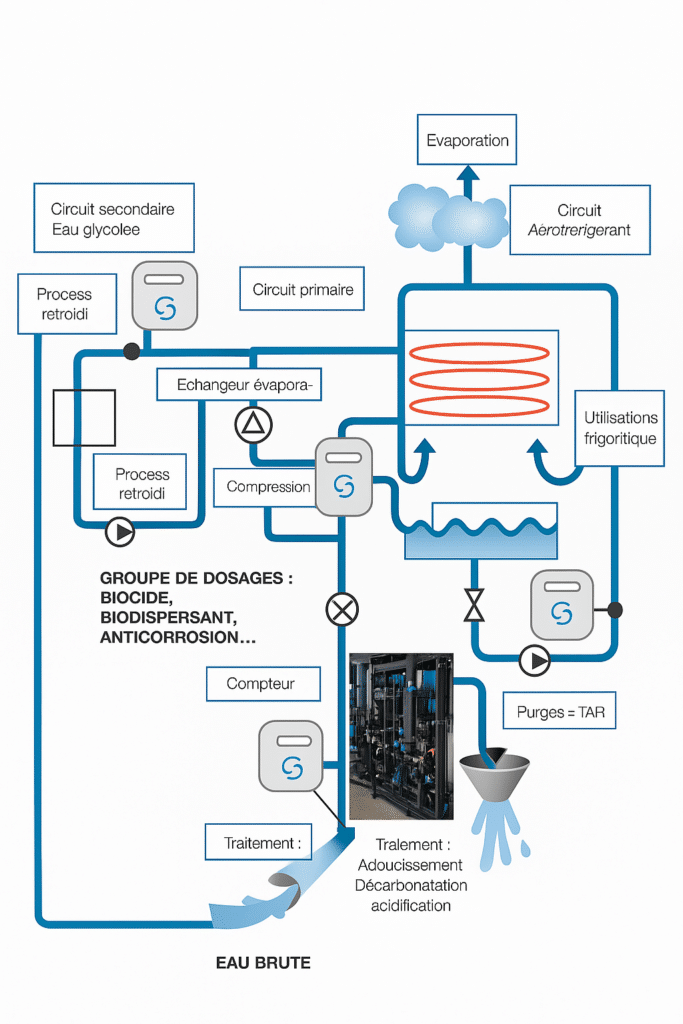
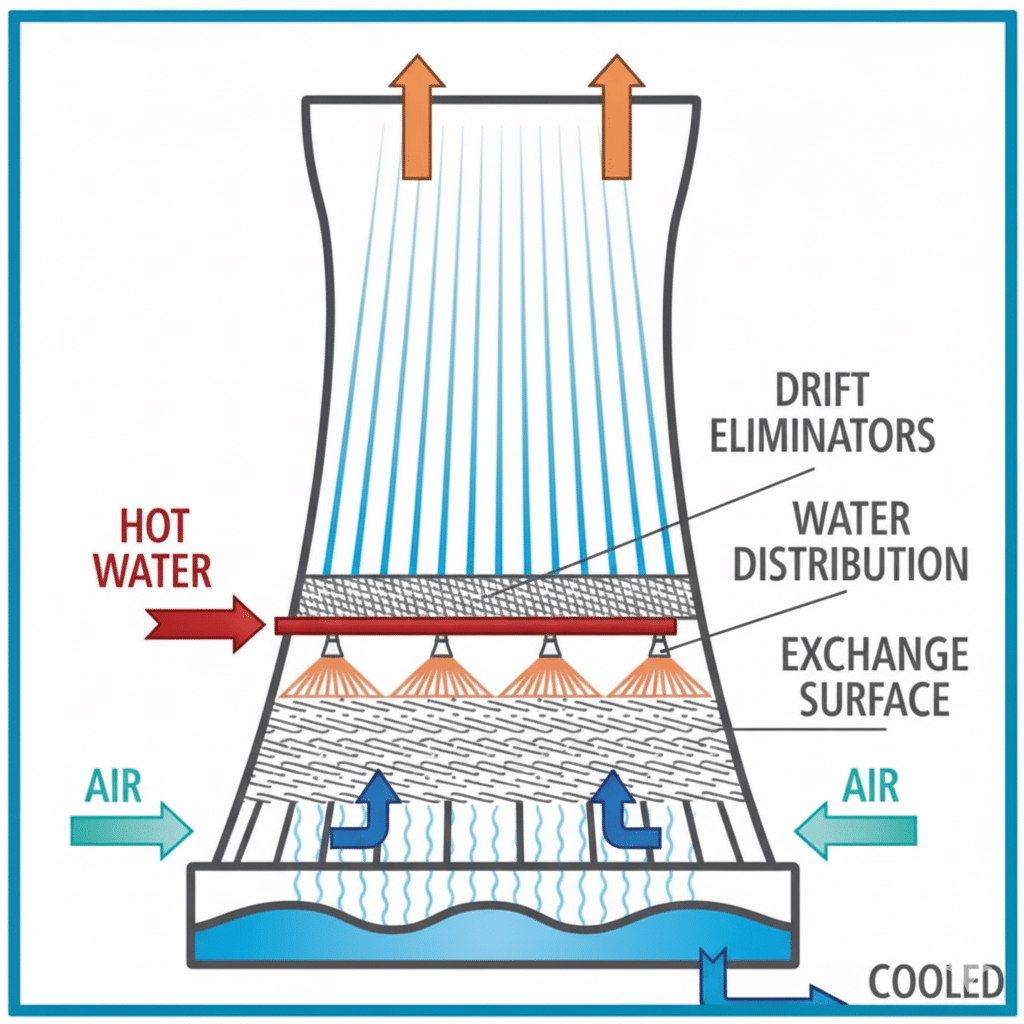
Cooling system diagram
A cooling tower operates on a recirculation principle: hot water from the industrial process is sent to the tower, sprayed, then cooled through contact with ambient air before being returned to the circuit.
Understanding this circuit helps identify where losses, evaporation, deposits or corrosion phenomena occur, and supports the definition of appropriate monitoring frequencies.
(Cooling tower water analysis diagram | AQUALABO)
Understanding cooling tower efficiency
A tower’s thermal performance can be assessed based on the cooling achieved between inlet and outlet temperatures: (Inlet temperature – Outlet temperature = ΔT).
- Performance calculation (ΔT) = (Evaporation x 660) / (Circulation flow rate)
- Evaporation = Make-up water – Blowdown
- Blowdown = Make-up water / Concentration
You need to know your make-up water (meter reading), your concentration (via chloride analysis if chlorine dosing is not too high), and the circulation flow rate (pump data). The average thermal performance of cooling towers is 5°C. Evaporation can be estimated, and blowdown can then be derived.
Major risks in cooling towers
Cooling towers expose water to conditions that simultaneously promote three major risks: corrosion, scaling and microbiological growth. None of these can be monitored independently, as they influence each other. This is why regulations related to Legionella risk require comprehensive physico-chemical monitoring.
Among these microorganisms, Legionella is a bacterium naturally present in aquatic environments that can develop in warm water when conditions are favorable. In a cooling tower, it can proliferate if water conditions are not properly controlled and may then be dispersed into the air as aerosols during tower operation.
To limit this health risk, regulations require regular physico-chemical monitoring of the water, in addition to microbiological surveillance. Monitoring key parameters helps maintain conditions unfavorable to Legionella growth, verify the effectiveness of applied treatments, and ensure sanitary compliance of installations.
Which parameters should be monitored in a cooling tower water analysis?
Analytical monitoring of a cooling tower relies on a set of complementary physico-chemical parameters. Each provides specific information about water condition, treatment behavior and the overall balance of the circuit. The parameters detailed below form the basis of routine monitoring, directly usable by operators and technicians responsible for cooling tower follow-up. Depending on tower configuration or treatment requirements, additional parameters may also be measured.
Total hardness (TH)
High hardness promotes scale formation on heat exchangers, reducing thermal efficiency and potentially interfering with certain chemical treatments. Its evolution directly reflects salt accumulation due to evaporation and indicates scaling risk on heat transfer surfaces.
Regular monitoring of hardness helps adjust blowdown and assess whether anti-scale treatments remain appropriate for actual operating conditions.
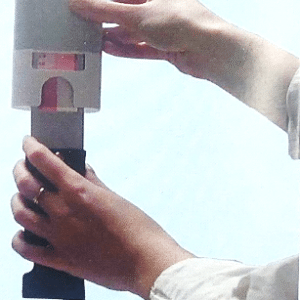
Measure water hardness quickly and easily to adjust your systems or perform on-site checks.
Phenolphthalein P-Alkalinity & Total Alkalinity (M o Methyl Orange)
Measuring alkalinity helps anticipate pH variations and identify imbalances that may lead either to corrosion or to salt precipitation. This parameter is essential for correctly interpreting pH trends and adjusting treatments.
pH
pH plays a central role in the chemical balance of a cooling tower. It affects the performance of inhibitors, biocides and dispersants, and directly influences corrosion and scaling. Monitoring pH helps verify the overall consistency of the treatment program and quickly detect chemical drift before equipment is impacted.
Iron
Iron presence is a common indicator of internal corrosion. Monitoring helps confirm a diagnosis supported by other parameters (pH, alkalinity) and detect premature material degradation or ineffective corrosion inhibition before the issue becomes visible or critical.
Chlorides
Chlorides are used as a reference parameter to calculate concentration cycles. Measuring chlorides helps control blowdown and manage water concentration in the circuit. They also act as an alert signal for corrosion risk when levels become too high, especially for certain sensitive materials.
Cooling tower water analysis: recommended frequencies
Each parameter requires regular monitoring depending on its role in circuit supervision:
Parameter | Raw Water | Make-up Water | Cooling Tower | Closed loop |
Ca++ | M | D | D | |
Total Hardness | W | D | D | W |
P-Alkalinity | D | W | ||
M-Alkalinity | W | D | D | W |
Cl- | W | D | D | |
Iron | W | D | D | W |
Cu++ | W | W | ||
Chlorine | W | D | D | |
Triazole | W | W | ||
Phosphonates / Polyacrylates | D | |||
pH | W | D | D | W |
Cond. µS/cm | W | D | D | W |
Temp °C | W | D | D | W |
W = weekly, D = daily, M = monthly
Other possible parameters: Nitrite, Molybdenum, Glycol
Conducting internal analyses: equipment and methods
To build a complete analysis kit, Aqualabo provides methods listing essential equipment: volumetric flasks, Erlenmeyer flasks, graduated cylinders, automatic burettes, titrant solutions, color indicators and reagents adapted to each parameter. Our solutions ensure reliable, repeatable monitoring aligned with field requirements.
Equipment for volumetric analysis
Equipment / Parameters | Ca++ | Total Hardness | P-Alkalinity | M-Alkalinity | Free Mineral Acidity | Cl⁻ | CO₂ |
Titrant solution | 1LC009 | 1LC009 | 1LA026 | 1LA026 | 1LA008 | 1AN031 | 1LA026 |
Color indicator | 1IE001 | 1IN000 | 1PT001 | 1RT004 | 1H0001 | 1PC005 | 1PT001 |
Preparation reagents | 1RA001 | 1TK004 | 1A0001 | 1LA008 | |||
Method No. | 303B | 302B | 305 | 306B | 309 | 314AG | 301 |

Erlenmeyer flask 100 ml – 1FE003
Erlenmeyer flask 250 ml – 1FE004
Volumetric flask 50 ml – 1FJ001
Volumetric flask 100 ml – 1FJ002
Plastic graduated cylinder 25 ml – 1EG001
Use one burette per titrant solution
- Automatic burette, direct reading 0 to 30 °f – 1BZ001
- Automatic burette in ml 0 to 15 ml – 1BZ000
Schilling burette 0 to 25 ml – 1BS012
Equipment for colorimetric analysis
Parameters | Kits | Test strips |
Chlorine | 1KC001 | |
Sulfates | FMN931092 (Turbidity) | FMN91320 |
Quaternary ammonium | 1KA018 | |
Molybdates | 1PI325 | |
Nitrites | 1PI322 | |
ORCHIDIS comparator – 1CH003
One pair of A/B cuvettes – 1CA005
Analyze your cooling tower with Aqualabo to optimize your installation
Water analysis is a key lever to ensure proper cooling tower operation and control physico-chemical drift. Aqualabo offers operators a complete range of kits, reagents and analytical methods adapted to cooling tower constraints. These solutions help effectively monitor scaling, corrosion and biological growth, while supporting decision-making in the field.
Aqualabo teams support industrial sites in selecting methods and analytical equipment to implement reliable, consistent and operational monitoring.
Contact our teams to define the equipment and reagents that match your needs: